
As we all get ready for the imminent iOS14.5 release, waiting for half of the world’s unique device identifiers to disappear in a Thanoid snap of fingers, there is still substantial uncertainty as to the most effective – or least ineffective – way to steer user acquisition in the rough waters ahead.
Over the past several months we have walked with clients and partners through analyses and preparations, embracing different approaches to No-IDFA optimization according to their specific app genres, monetization strategies, and risk propensity. The bottom line is, there’s no right or wrong setup, and on the verge of a new era, there’s very little certainty on the way things will actually pan out. Outside-the-box thinking and nimble adaptiveness are going to be the best tools to manage the inevitable disruption.
How is everyone bracing for impact?
Here is an overview of the different stances that are rising across the ecosystem, specifically around conversion-value, the one artifact left to supply performance indicators for UA optimization.
Embrace or Evade
The first conundrum which all mobile publishers are facing is whether to embrace SKAdNetwork (SKAN) postbacks as the sole source of data to optimize upon, or rely on the ‘probabilistic attribution’ that MMPs are pushing forward to ensure business as usual post-iOS14. Probabilistic attribution is meant to ensure regular post-install performance postbacks with campaign/publisher/creative granularity even in lack of a deterministic way of attributing (now anonymous) users’ behavior to their campaign/publisher/creative of origin.
Incomplete-But-Reliable or Complete-But-Unreliable?
In all fairness, the probabilistic path doesn’t seem like the most promising option: while the sweet illusion of being able to escape the end of mobile marketing as we know it is surely inviting, Apple has made it clear that the very concept of identifying a user across multiple apps – whether deterministically or probabilistically – would be an infringement of their App Tracking Transparency (ATT) policy.
And while the recent Adjust episode is not directly related to iOS 14.5, it does send a clear message that Apple is not going to take it easy on quiet attempts to maintain device-level intelligence.
Yet enforceability is the key, and the uncertainty on the extent to which Apple will actively engage against probabilistic workarounds may be enough for some to try and rely on that comfortable blanket of post-install signals ‘for just a bit longer’, and see how effective that will actually be. Which may take a while to measure, as the lack of a deterministic benchmark gives enough ground to any claims for accurate probabilistic enrichments to ‘work until proven wrong’.
One postback
Those that decided to fully embrace SKAN and just deal with it (the vast majority of mobile app publishers so far) have been facing a second conundrum: how to make the most sensible use of their SKAN postbacks.
Under the new SKAN framework, you are now given ONE single postback per user, so you’d better pack in as many indicators as possible of your users’ worth. You may want to track indicators of early engagement, monetization, perhaps retention… But you’re also given the limitation of one single ‘Conversion Value’ in that one postback, meaning you’ll have to flatten all the relevant clues of a user’s worth into a single numeric figure. To top it all off, your one postback with your one conversion-value will come to you with a non-deterministic delay after the install occurred – a time that is randomized by Apple and you may only partly control.
Postback timing
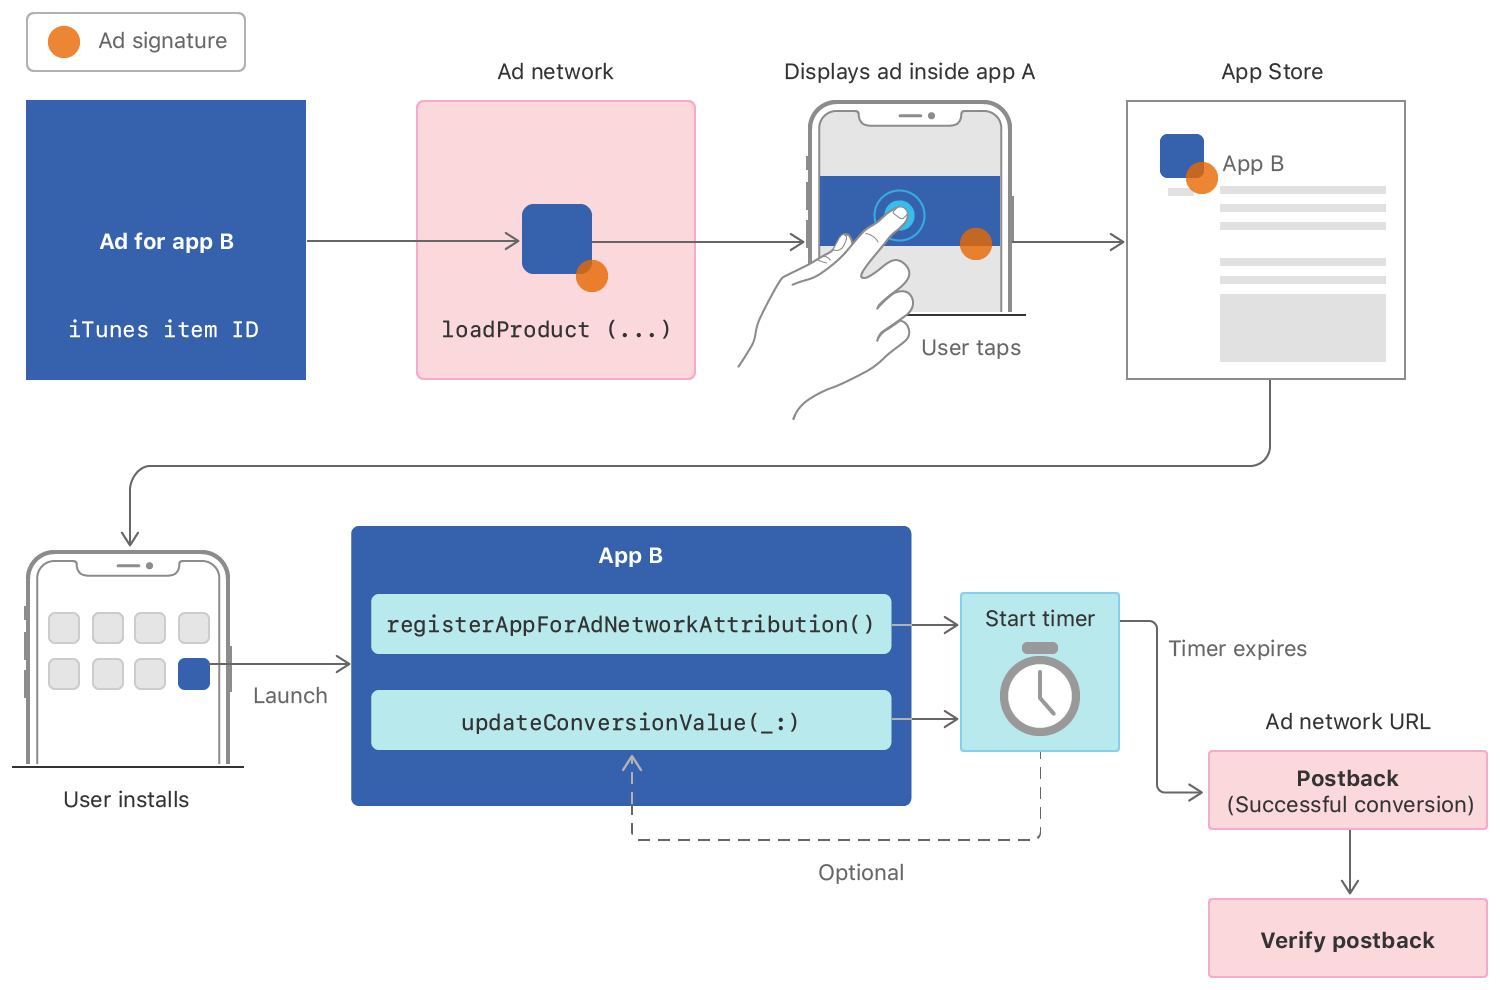
SKAN substantially enforces an out-out tradeoff between information timeliness and completeness, with no viable expedients to achieving both. Here’s how it works: a 24-hour countdown starts as soon as a new user installs your app; within those 24 hours you’ll have to update the user’s conversion-value (which you may do multiple times as you collect more engagement signals, granted that each update is incremental so conversion-value may only increase over time). Every update triggers a reset of the 24h countdown and when the timer finally hits zero the postback from Apple to the ad network will be ‘instructed’ – subject to a further random delay between 0 and 24h meant to obfuscate any deterministic time-based attribution attempt.
There isn’t much you can do to work around the long and partly unpredictable delays in SKAN postbacks. Accept that you’ll have to be bold and keep spending blindfolded for a couple of days at the very least, before being able to appreciate the outcome of your previous adjustments and steer your campaigns further.
Now how long should you actively try to delay your postback to pack more performance indicators? Between timeliness and completeness, most publishers so far are leaning toward the former, aiming to minimize the delay as much as possible, and possibly even avoid any timer reset. However that doesn’t really suit apps and games that rely on late monetization – think midcore games or social casinos: in those situations, an additional 48 or even 72-hour extension to gather further user engagement signals may be vital to tell high potential users or publishers from the crowd. Such apps indeed try to leverage timer resets, in some cases even as far as 7 days, to let more sporadic monetization clues come in.
Conversion-value
SKAN postbacks’ conversion-value is a 6 bit field – meaning, it can carry one of 64 possible values, as an integer between 0 and 63. That gives you a tiny room for customization that oddly feels like an exciting relief given the overall limitations of the framework. Now how to make the most of that integer? How to map your multiple user signals to a flat series of 64 discrete values?
Since every app is different, that’s something that needs to be designed case by case, according to your app’s DNA, its in-app mechanics and monetization model, whether predominantly based on In-App-Purchase, Ads, Subscription or E-commerce.
Mapping Strategy 1: Common Unit of Worth
The most straightforward approach is to find a common ‘unit of worth’ that all the possible indicators of a user’s value (engagement, retention, ads viewed, in-app purchases made, etc.) may be normalized upon. A ‘unit of worth’ that may then be split into 64 discrete values, or ranges of values. This is well suited to ad revenue based apps, or any other apps where a common underlying value indicator can reasonably be found across events.
An example is to treat each ad viewed by a user in her first 24 hours as the ‘unit of worth’, and then map the user’s “total 24h worth” to one of 64 increasingly coarser ranges:
| conversion-value | User’s 24h worth |
| 0 | 1 to 3 units (ads viewed in the first 24 hours) |
| 1 | 4 to 10 units |
| 2 | 11 to 20 units |
| …63 | … |
Of course, you may also factor each impression’s ad type and/or placement into it through multipliers, for example defining that each video ad impression delivers 3 ‘units of worth’, and each playable delivers 5, while a banner only delivers 1.
Note that mapping normalized ‘units of worth’ is preferable to mapping the actual dollar value of the generated impressions, which would suffer the delays of ad revenue attribution, as well as inevitable fluctuations in pricing on the demand side, independently from the user behavior that you are trying to evaluate.
A different example of how a normalized ‘unit of worth’ may be stored in SKAN postbacks’ conversion-value is pLTV. The idea is to gather early user performance signals to compute a client-side forecast of future monetization (predicted LTV), and pack such estimate into the postback. This however comes with a few issues tied to the fact that LTV was predicted on the client (the app itself), namely the complexity of breaking apart the compiled pLTV at a later time into its building components – if need be – and the loss of backward-comparability every time the forecasting algorithm is updated.
Mapping Strategy 2: Engagement Matrix
A different technique is to build a matrix where certain portions of the 64 values are reserved to different engagement indicators, each using its available values to reflect its own dimensionality. That is more suited to situations where you’d like to obtain a more specific indication of which events were completed by the user, delegating the conclusion on the user’s worth to the time of analysis. Here’s a simplified, purely hypothetical example for a racing app:
| conversion-value | User engagement |
| 0-20 | Race completed [21 values used to map the highest number of races completed before the postback countdown ran out] |
| 21-27 | User retained [7 values used to track the farthest retained day (D1 to D7) before the countdown ran out] |
| 28-63 | Purchase made [36 values used to track the total purchase value before the countdown ran out] |
Since conversion-value can always only be updated upward, the caveat is that you’ll need to pick events that represent incremental progress in the user funnel, so a postback reporting a ‘Race 20 Completion’ means the user did not relaunch the app on the second day and did not make any purchase before the 24h timer expired; a postback reporting Day-3 Retention means the user never got to make a purchase before the countdown ran out and did not relaunch the app on the Day-4.
The condition “before the countdown ran out” is crucial here: counter-intuitively, it means that the longer you allow your SKAN postback to be delayed, the more uncertainty you’ll end up with. For example, a postback reporting Day-3 Retention simply means the user did not launch the app on Day-4 (hence the 24h countdown fired the postback) although she may have launched it on day 5 or 6 or 7. You’ll never get to know that.
Imagine two users: UserA spends $1 on Day-1 and $20 on Day-5, UserB only spends $2 on Day-1. UserA is clearly worth more, however the 24h countdown will fire the postback when UserA only generated $1 of revenue, qualifying UserB as the best performer.
For this reason we strongly advise that you minimize timer resets whenever early indicators of future value can be identified (and posted back) within the first 24~48 hours: that will give you fewer clues per user, but will make users (and any coarser aggregation, ie. publishers or campaigns) more comparable against each other.
A slightly more sophisticated (and more realistic) way of mapping SKAN’s conversion-value to an engagement matrix is to associate each of the 64 values to a specific user journey (example below). While this doesn’t remove the general issue of longer delays being associated with less comparable data, it at least provides more informative clues of the different checkpoints the user passed along her journey until the latest postback countdown reaches zero.
| conversion-value | User journey |
| 0 | Level 5 completed in the first day [with no further key event before the countdown ran out] |
| 1 | Purchase made in the first day [with no further key event before the countdown ran out] |
| 2 | Level 5 completed in the first day AND Purchase made in the first day [with no further key event before the countdown ran out] |
| 3 | User retained for 2 days [with no Level 5 completion or purchase made the previous day] |
| 4 | User retained for 2 days, after Level 5 completion the previous day |
| 5 | User retained for 2 days, after Purchase made the previous day |
| 6 | User retained for 2 days, after Level 5 completion AND Purchase made the previous day |
| 7 | User retained for 2 days AND Level 5 completed in the second day |
| …63 | … |
In this setup, few key events should be picked as the most representative ones in the engagement funnel, so as to allow tracking multiple combinations through the 64 available slots, without having to choose whether to track Level Completion or Retention, or whether Retention is more valuable than Level Completion hence taking higher slots of the conversion-value: the increasing values are used to reflect the sequence of the events (and possibly even the time when each occurred, if that is a dimension that matters to you and if you plan to delay your postback beyond the first 24 hours) rather than their importance/value.
Key early events
As we saw in many situations – especially when timely postbacks are preferred to long-delayed ones, when apps rely on later monetization, or when conversion-value is mapped to an engagement matrix – you’ll want to track early engagement metrics that prove a reliable proxy for future monetization (some of which may actually be early purchases themselves, but not at all necessarily). How to identify such key events?
Though the implementation can be very sophisticated, the concept is rather simple: it’s all about iterating through all the events you are tracking in your app and calculating a correlation index between their Day-0 and Day-1 values, and the later monetization milestone you aim to achieve (e.g. Day-7 ARPU). If any strong correlation is found, those events may be used as early proxy for future revenue. It may even be a mix of multiple highly correlated events, as long as their value can be normalized on one common scale from 0 to 63.
The Kraken has a dedicated built-in algorithm that does just that, and that’s nothing new. For over four years, one of its key capabilities helping app publishers achieve their performance goals has been the ability to identify and continuously discover early actionable clues of ‘potential’, and optimize user acquisition on top of those. Feel free to reach out and request a free consultation or a preview of our correlation inspector.
APPocalypse
Meanwhile time is ticking, and mobile marketing progresses toward a time of uncertainty and undoubted challenges. Like any transformation, that will come with a good share of discomfort and transition costs. Like any transformation, it will mark the end of an era and the beginning of a new one. Interestingly, these radical changes won’t simply start a new era for user acquisition, but for the mobile ecosystem as a whole. The nature of apps will change, and with that, the way people experience and engage with digital content.
Mobile apps and games will likely need to redefine their user journeys around the new data tracking restrictions, tentatively anticipating the moment when they request users (in explicit or implicit ways) to manifest their intention to spend, and how much.
Does this mean the end of free-to-play? Maybe, but most likely not. It’s rather going to be an evolution, in a direction where users will be offered different ways of experiencing content and monetizing within the app, possibly choosing between IAP, ads, subscription, but in a clearer and more explicit fashion. When the freemium model took ground as the dominant monetization strategy for mobile apps, a decade ago, that led to an important shift in app and game design, with continuously evolving techniques to incorporate In App Purchases and Ad Revenue without compromising – if not enhancing – the overall user experience. A similar paradigm shift is likely to take place in the months and years to come, as apps reinvent themselves to optimize for early commitment and proof-of-value, and users mature to a new awareness of their direct role in supporting and directing the ecosystem.
The Kraken
Bubbleye’s Kraken is the world’s first and most comprehensive UA Automation platform for mobile marketers. It features holistic real-time reporting, multiple algorithms to address specific pain points (LTV prediction, budget allocation, bid adjustments, traffic exploration, custom alerting, fraud blocking, A/B testing, and a lot more), and a console to fully customize your desired balance between automation and hands-on control.
If you are interested in harnessing the power of AI for your mobile marketing and propel your apps’ growth, don’t hesitate to book a free demo.